Bring sources together
Connect CSV and Excel files, databases, warehouses, and APIs. Map schemas and organize data for analysis.
Bring data engineering, interactive analytics, and machine learning into a shared platform—from source connections to deployed predictions.
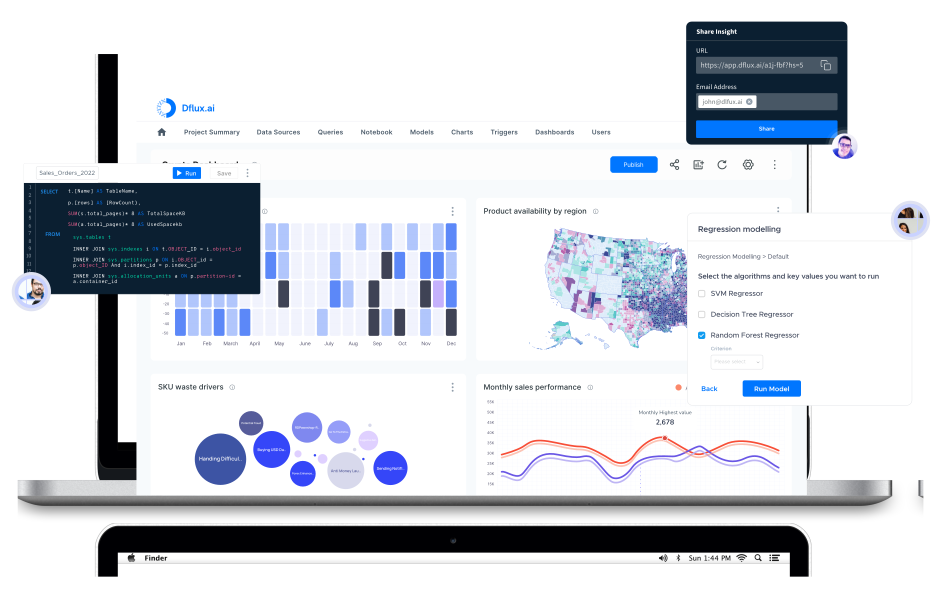
Bring data preparation, analysis and predictive modeling into a workflow that starts with an operational question.
Map · Validate · Organize
Explore demand.
Evaluate a forecast.
Bring together the relevant source data.
Map fields and validate usable records.
Explore patterns and test a forecast.
Share the evidence for the next action.
Connect CSV and Excel files, databases, warehouses, and APIs. Map schemas and organize data for analysis.
Use SQL, interactive dashboards, filters, and drilldowns to investigate the data and communicate findings.
Apply AutoML to classification, regression, and forecasting. Use Python and R notebooks when a task needs code.
Query history and sharing help teams collaborate. Validation, triggers, notifications, and dashboard refreshes support recurring work.
TekStripes lists role-based access, audit logs, and on-premises options. Confirm the right configuration for your data and operating environment.
A program office tracks requests, staffing and service volumes in separate files and systems. Teams need a consistent view of demand to support resource planning.
A proposed approachCombine a bounded set of historical records, validate definitions and build a shared demand view. Test a forecast against past periods before using it in planning discussions.
Continue to TekStripes’ contact page to discuss Dflux.